Project Description
No one likes being left behind. To stay competitive, Australia must move fast to become Asia-Pacific’s leading AI and cloud hub. The CSIRO estimates digital technologies, including AI, could add $315 billion to our economy by 2028 [1]. The question is: how do we get there?
The answer lies in data centres.
Think of them like airports. Airports connect people to the world; data centres connect us to information, AI, and digital services. If an airport is too far away, travel slows and opportunities are lost. The same is true for data centres: their location shapes speed, reliability, and whether businesses and communities can truly benefit from emerging technologies.
But just like airports need smart planning and clear flight paths, data centres need intelligent placement and public trust. And with billion-dollar investments already coming from Amazon, NextDC and Goodman Group, the time to act is now.
Introducing Datafields — the latest solution from Team Data Revolution.
Datafields is an advanced analytics platform that helps policymakers, energy providers, investors, and communities plan the future layout of Australia’s data centres — and the energy they’ll require.
It has two key components: data-driven location intelligence and an interactive simulation.
With location intelligence, Datafields analyses infrastructure, energy, and geography. Using the Digital Atlas of Australia, we mapped power stations, transmission lines, and fuel types — essential for assessing if a site can sustain a tier 1 through to a tier 4 data centre, which often need multiple, diverse power sources and redundancies.
The simulation lets users set a budget, pick a site, and design a data centre profile. It shows construction costs, IT capacity, uptime guarantees, latency to nearby communities, and the grid impact. We integrated Australian Bureau of Statistics (ABS) population and Consumer Price Index (CPI) statistics to project demand growth and energy needs, ensuring decisions aren’t just good for today but also sustainable long term.
And here’s where AI makes a difference: Datafields doesn’t just throw numbers at you. It interprets results in plain language. Instead of “x megawatts required,” it tells you:
-Is this site affordable?
-Is it sustainable?
-Will it stress the grid or benefit the community?
This transforms raw data into actionable insight, building trust and clarity for decision-makers.
The purpose of Datafields is simple: smarter, more transparent decisions about where to build and how to power Australia’s digital future.
This isn’t just about servers. With Datafields, Australia can cut through the noise, plan smarter, and secure its place as the digital powerhouse of the Asia-Pacific.
Let’s build it wisely.
Join the mission. Try Datafields today.
[1] https://www.industry.gov.au/publications/list-critical-technologies-national-interest/ai-technologies
Data Story
Note: Some sections of this analysis was undertaken with AI assistance, for example, in forming summaries or interpreting insights.
Data Centres
Data Centre Tier Analysis
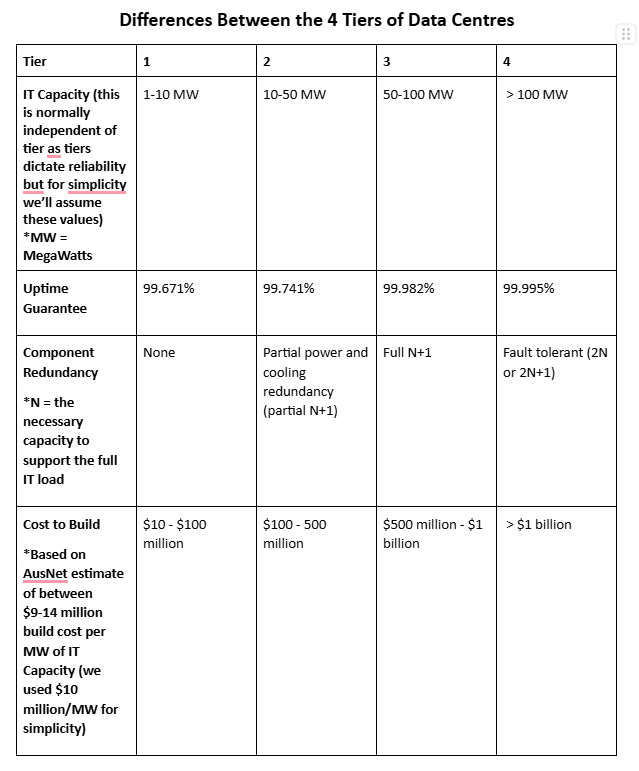
We explored various resources including energy.gov.au, to understand the differences between the four tiers of data centres so that we could implement these insights as data centre profile characteristics in our solution simulation. Below is a table comparing IT capacity, uptime guarantee, component redundancy and cost to build.
Power Usage
We used an ABC article (https://www.abc.net.au/news/2024-07-26/data-centre-electricity-grid-demand/104140808 ) to understand the impact and influence of the data centres currently on the Australian power network. From the article, we extracted the estimative total electricity demand of data centres in Australia in 2024 and 2030, based on scenario A (8% usage of the electricity grid in 2030) and scenario B (15% usage of the electricity grid in 2030). For both scenarios, we determined the average yearly growth in electricity demand and the electricity demand in MegaWatts (MW).
From the article:
“Australia is one of the top five data centre hubs in the world.
There are 214 data centres spread across the country, according to the Australian Information Industry Association.
…
Just one large data centre can consume the same amount of energy required to power 50,000 homes. Morgan Stanley estimates that data centres are currently using 5 per cent (1,050 MW) of the electricity on Australia's power grid and that is expected to grow to 8 per cent (2,500 MW) by 2030. Some estimates even suggest they could require up to 15 per cent of the power on the grid by then.”
We used these values to extrapolate the average increase in total data centre electricity usage over time until 2030, for scenario A where data centre electricity usage is expected to grow to 2,500 MW or 8% of the electricity grid usage; and scenario B, where data centre electricity grid usage is expected to grow to 15%. Below is a graph showing the increases for both scenarios, assuming uniform growth.
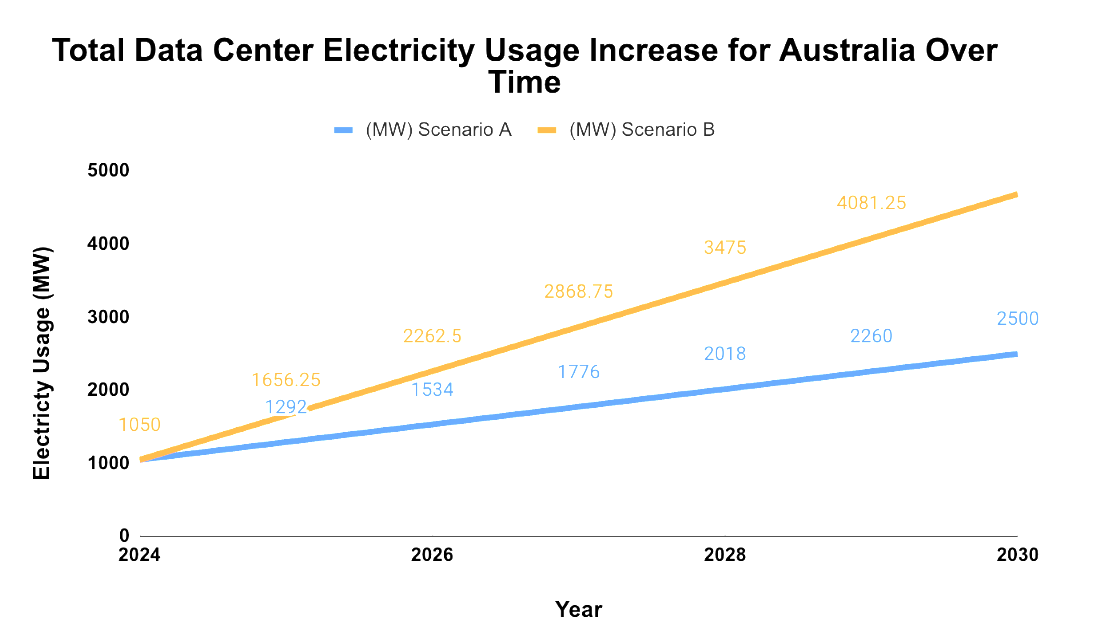
Scenario A
Based on uniform growth,
-total data centre electricity usage increases from 1,050 MW to 2,500 MW to 2030
-total data centre electricity usage increases by 23.05% or 242 MW each year - this also equates to a 0.5% growth in electricity grid usage.
Scenario B
Based on uniform growth,
-total data centre electricity usage increases from 1,050 MW to 4687.5 MW from 2024 to 2030
-total data centre electricity usage increases by 57.74% or 606.25 MW each year - this also equates to a 1.67% growth in electricity grid usage.
Our solution will use the yearly electricity grid growth rate above for simulations over time.
Power
Major Power Stations
We used Digital Atlas of Australia (Geoscience Australia) data to determine the breakdown of class (renewable vs. non renewable), generation type, primary fuel type and location for operational major power stations in Australia. Additionally, we calculated the total and average electricity output of these power stations.
We filtered out records (major power stations) where Operational Status is Decommissioned, Non-Operational or Proposed - leaving only records where Operational Status is Operational.
We then used UNIQUE and COUNT functions in Excel to produce summary statistics to determine the breakdown of major power station class, generation type and primary fuel type. Additionally, we used the SUM and AVERAGE functions in Excel to calculate the total electricity output of the major power stations and the average electricity output of each major power station.
Summary Statistics
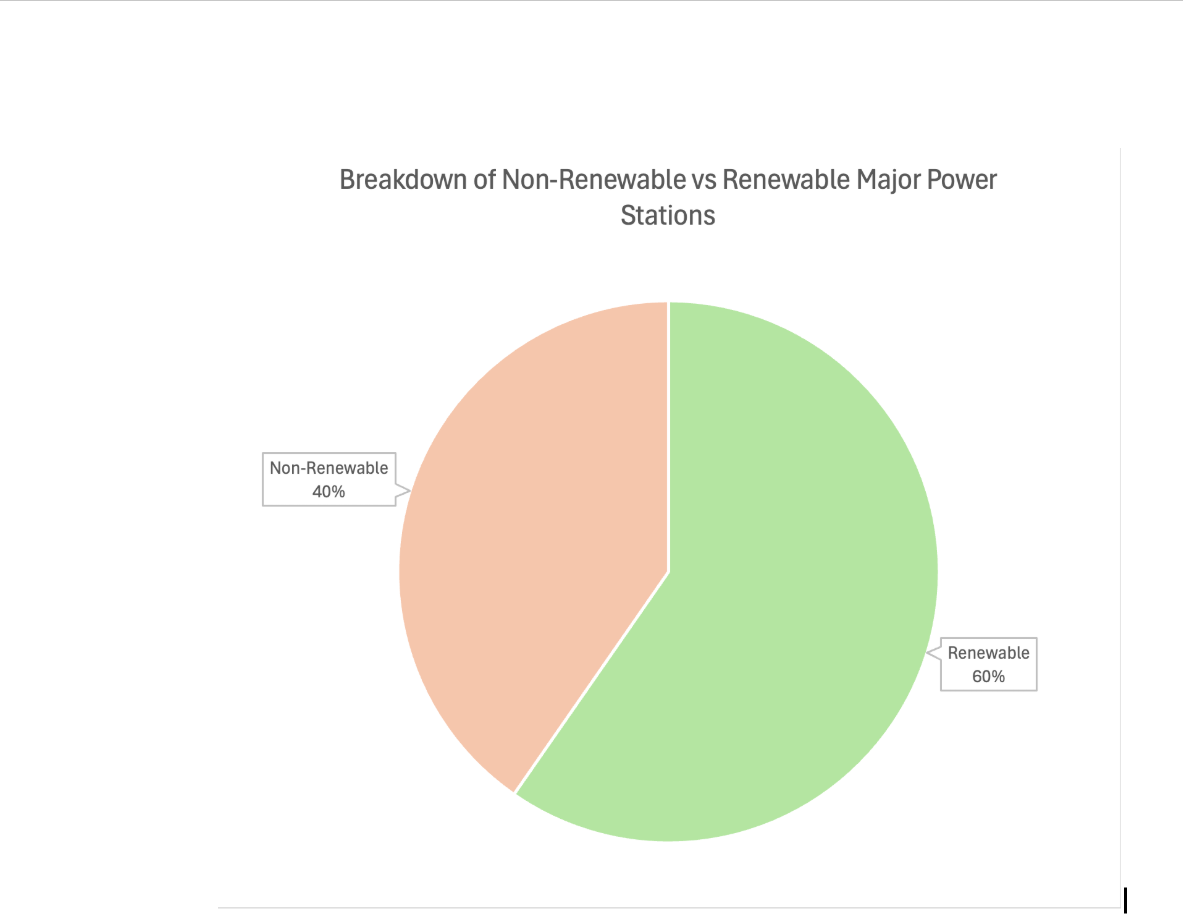
Breakdown of Renewable vs. Non-Renewable Major Power Stations
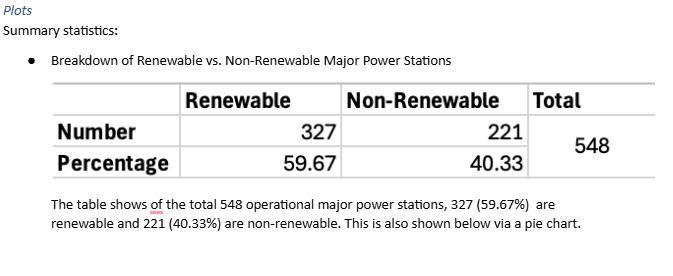
The table shows of the total 548 operational major power stations, 327 (59.67%) are renewable and 221 (40.33%) are non-renewable. This is also shown below via a pie chart.
Breakdown of Generation Type for Major Power Stations
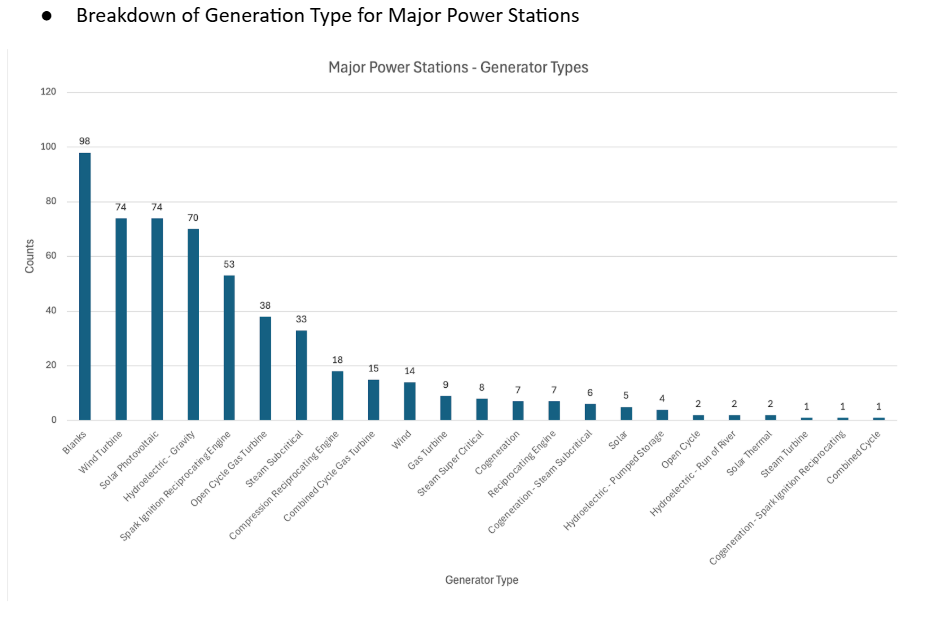
The bar chart above shows that there are many blanks for the generator type value in the dataset - in fact it is the dominant value in the dataset. After this, the primary values are wind turbines, solar photovoltaic and hydroelectric - gravity with 74, 74 and 70 respectively. These values reaffirm that renewable power generation is the primary generation type for the operational major power stations in Australia.
Breakdown of the Primary Fuel Types for the Major Power Stations
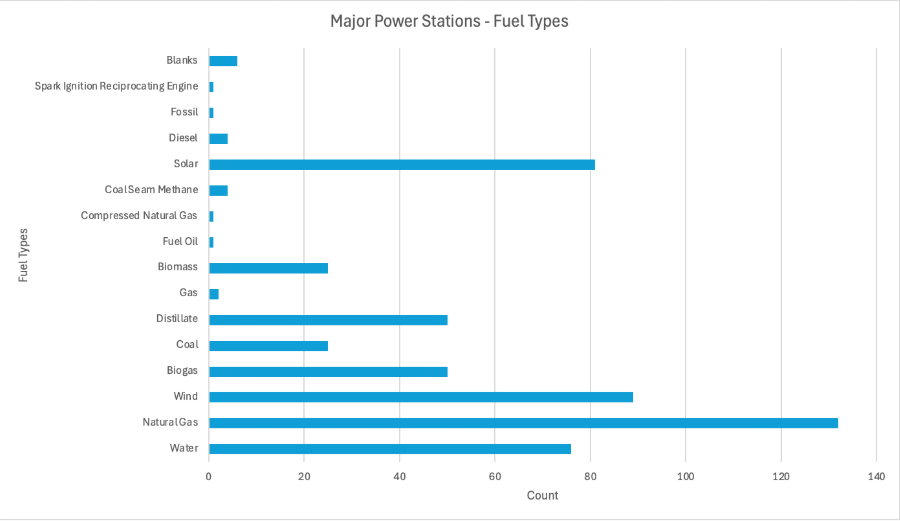
Natural Gas, Wind, Water and Solar account for the primary fuel types for most major power stations in Australia - reaffirming that most major power stations use renewable energy. This column also contains blank values but the blank values are a small proportion of the total values unlike previously.
Breakdown of Major Power Stations by State in Australia
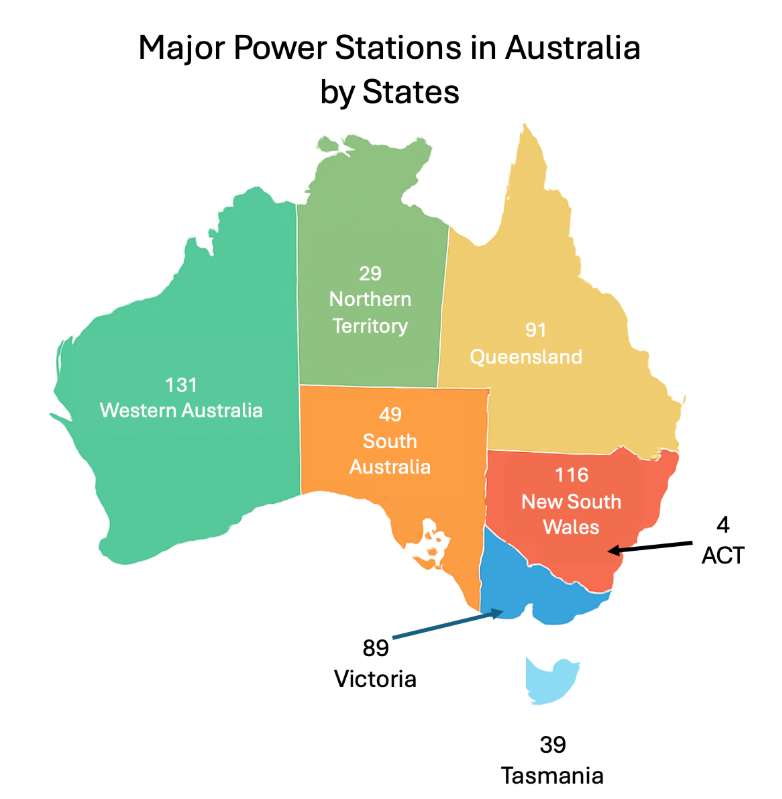
Western Australia has the highest number of major power stations at 131 and the Australian Capital Territory (ACT) has the lowest number of major power stations at 4, which is not unexpected due to their proportionate land mass.
Total and average power generation in MegaWatts (MW)
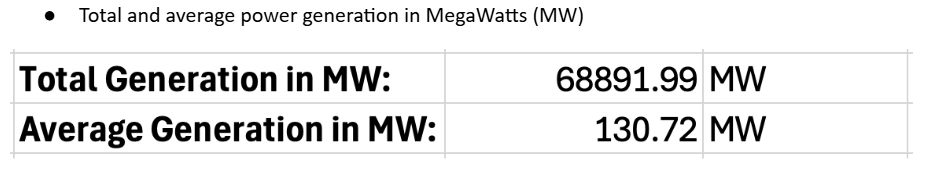
The total power generation of the major power stations in Australia is 68,981.99 MW and the average generation of each major power station is 130.72 MW.
Electricity Transmission Lines
We used Digital Atlas of Australia (Geoscience Australia) data to determine the breakdown of class and location for operational electricity transmission lines in Australia. Additionally, we calculated the total and average length and capacity of these electricity transmission lines.
We filtered out records (electricity transmission lines) where Operational Status is Decommissioned or Non-Operational - leaving only records where Operational Status is Operational.
We then used UNIQUE and COUNT functions in Excel to produce summary statistics to determine the breakdown of class and location for electricity transmission lines in Australia. Additionally, we used the SUM and AVERAGE functions in Excel to calculate the total and average length and capacity of these electricity transmission lines.
Summary Statistics
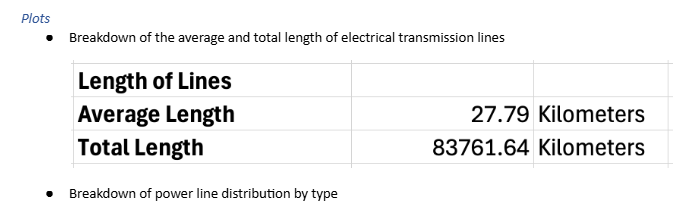
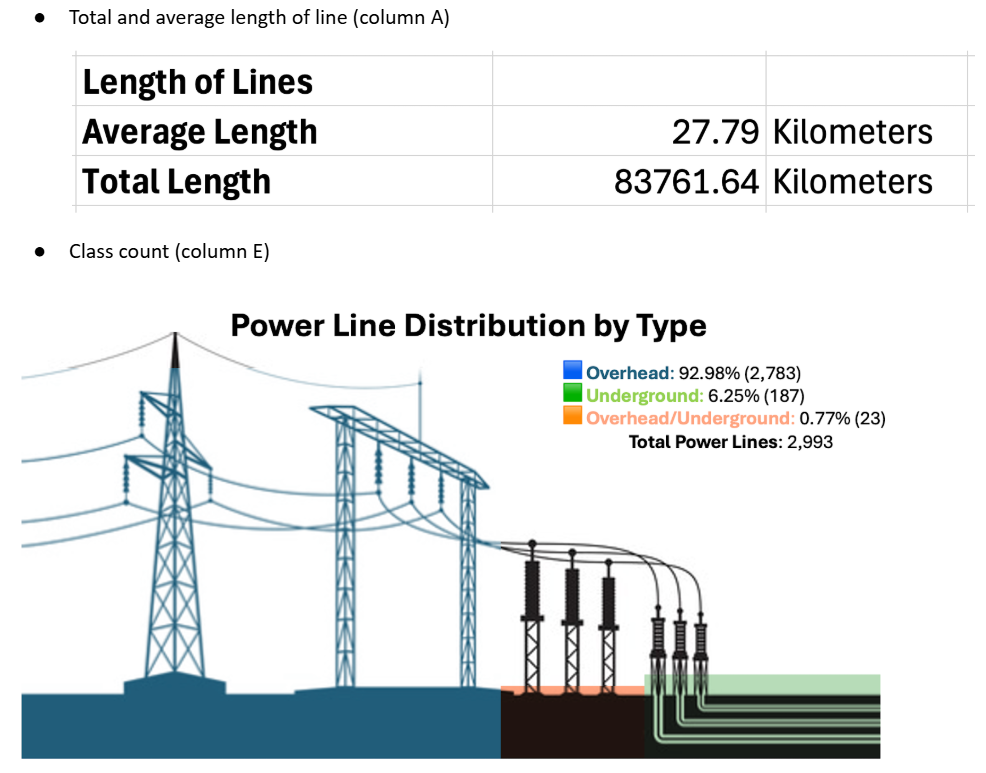
Breakdown of the average and total length of electrical transmission lines
Breakdown of power line distribution by type
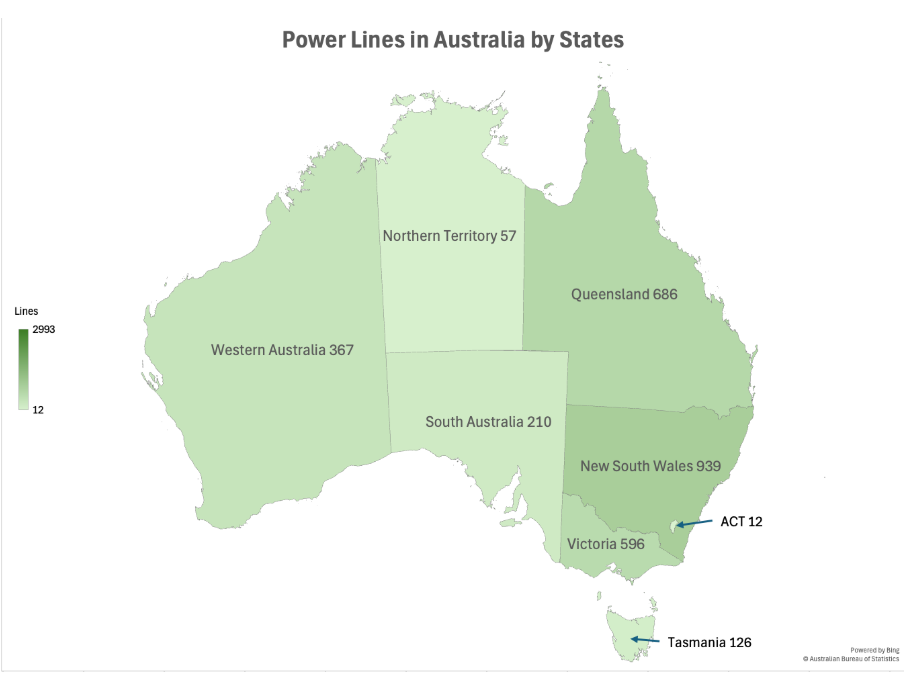
Breakdown of the electrical transmission lines in Australia
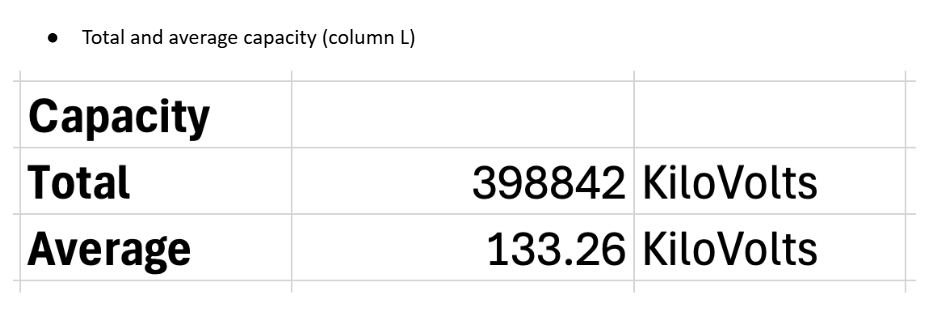
Total and average capacity of the electrical transmission lines in Australia
Electricty Costs
We used the Australian Energy Market Operator (AEMO) National Electricity Market (NEM) dashboard to extract electricity prices for use in calculating the cost of electricity for data centres.
Telecommunications
Telecommunications Lines
We used Telecom Australia's Telecom Information Kit No. 4 (https://oldaustraliantelephones.weebly.com/uploads/2/6/8/9/26897518/linking_a_nation.pdf) to extract a visual representation of Australia's telecommunications lines to analyse further.
Australia's Telecommunications Network
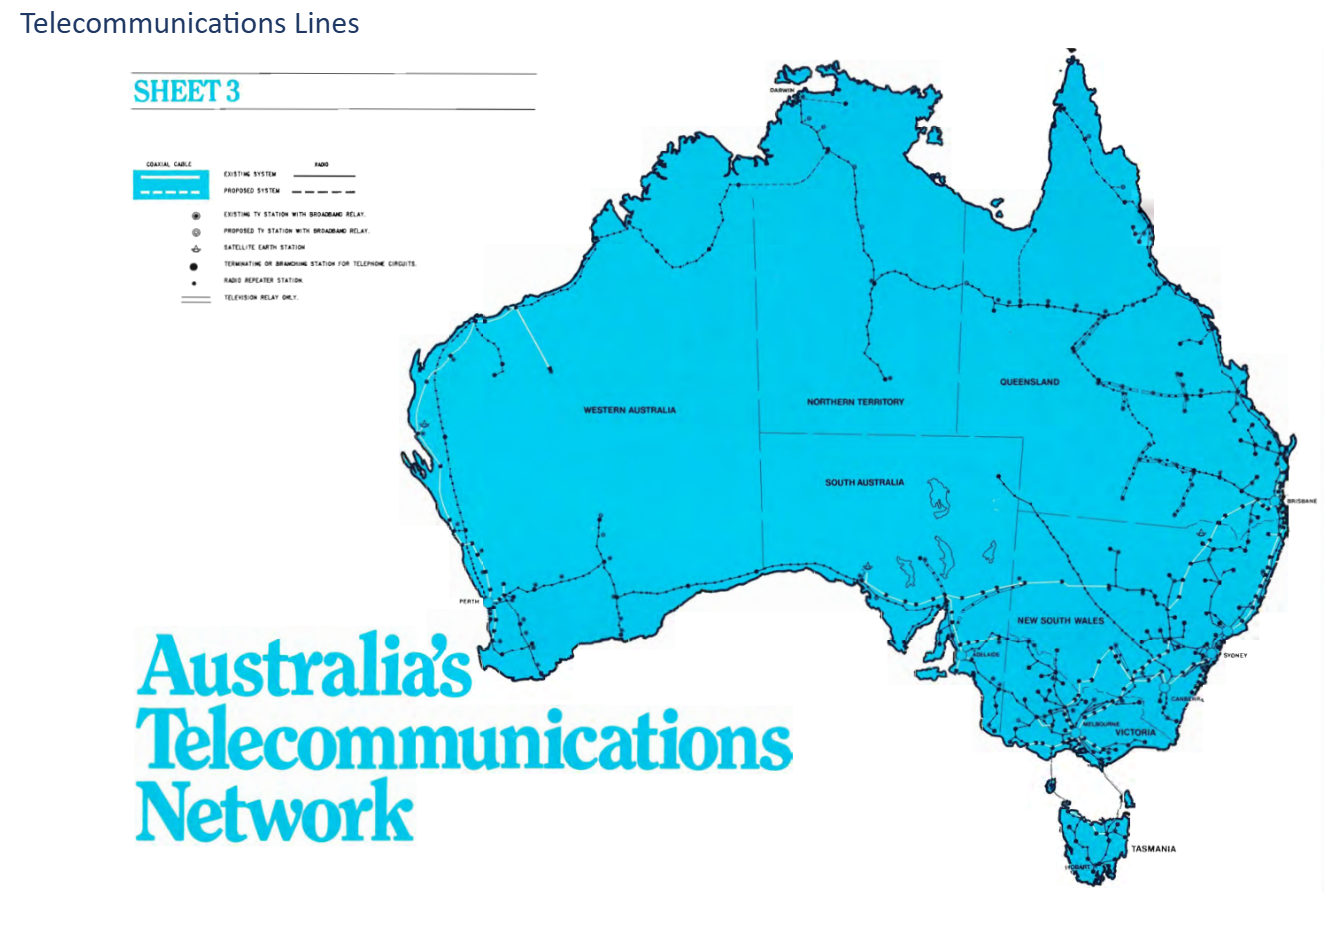
The map illustrates Australia’s telecommunications network as it stood at the time of publication. It highlights the nationwide infrastructure of coaxial cables, radio links, and proposed systems that connect major cities and regions. The network includes broadband relay stations, satellite earth stations, and other telecommunication relay points that enable telephone, telex, and data communication across the country. The system represents a mix of existing and proposed connections, indicating the expansion and modernisation of Australia’s communication backbone to reach urban centres, regional towns, and remote areas.
The visualisation highlights:
-Urban focus: Dense network coverage is concentrated in the southeastern states (New South Wales, Victoria, and Tasmania) and along the east coast (Brisbane, Sydney, Melbourne), where population and economic activity are highest.
-Regional connections: Lines extend inland to link regional hubs in Queensland, South Australia, and Western Australia, though with less density.
-Remote and rural areas: Northern Territory and inland Western Australia show fewer connections, relying on long-distance links and satellite stations to maintain connectivity.
-Coastal links: Major submarine cables and coastal relays connect the mainland to Tasmania and potentially support international communication routes.
Population
Population Increase
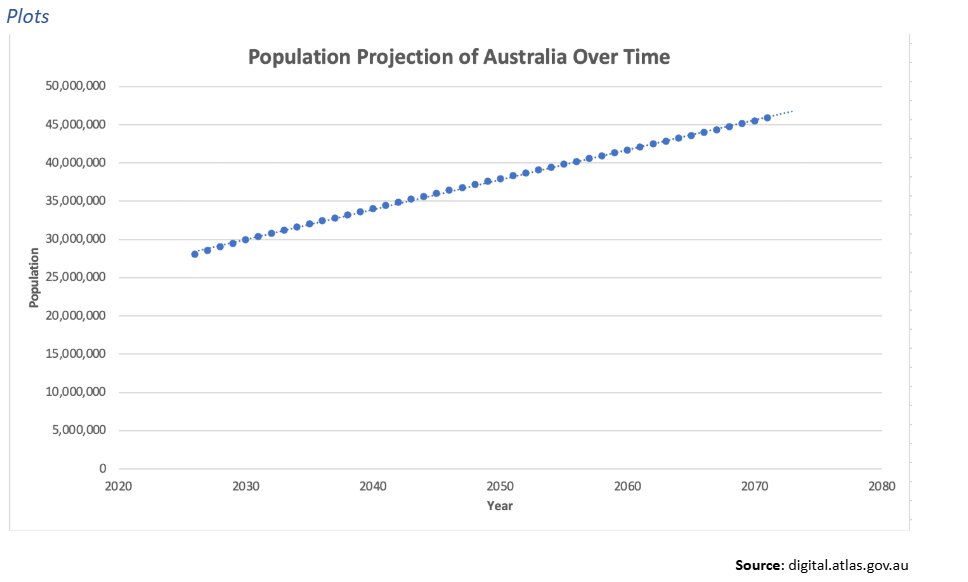
We used ABS data to determine and project average yearly population increase for Australia until 2070.
The ABS population clock and pyramid projection data is based on the estimated resident population at Wed, Jan 1, 2025 and assumes growth since then of:
-One birth every 1 minutes and 48 seconds.
-One death every 2 minutes and 48 seconds.
-One person arriving to live in Australia every 0 minutes and 54 seconds.
-One Australian resident leaving to live overseas every 1 minutes and 54 seconds.
An overall total population increase of one person every 1 minutes and 16 seconds.
Analysis - Calculation Method
There are 3,600 seconds in an hour, therefore 86,400 seconds in a day and therefore 31,536,000 seconds in a year. If we take the overall total population increase of one person every 1 minute and 16 seconds or 76 seconds, then 31,536,000 / 76 = a total population increase of 414,947 people per year.
Analysis - Calculation Method
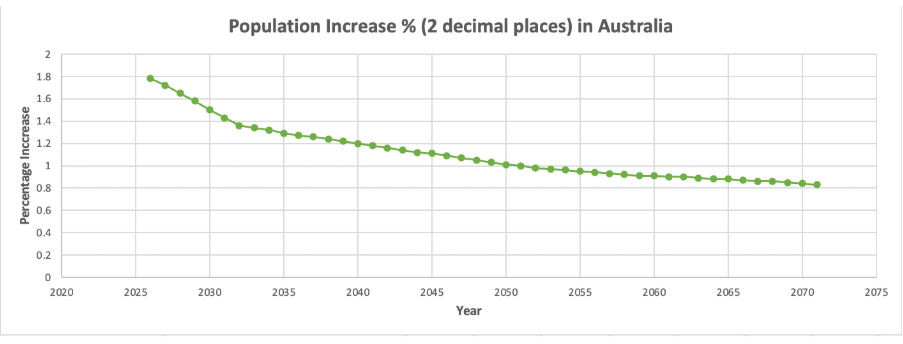
We saved the population predictions for the years 2025 - 2070 from the ABS Population Clock Pyramid data. We calculated the population increase in raw and percentage value between each year and then we determined that the average yearly national population increase is 1.11% or 397,704 people.
Australian population projections over time, for 2025 - 2070
Australian population increase percentages, for 2026 to 2070
Consumer Price Index (CPI)
From the data, we determined the average annual CPI (inflation) is 2.9%, considering the period 2016 - 2025.
Australia Consumer Price Index (CPI) - Quarterly and Annual Changes (2016 - 2025)
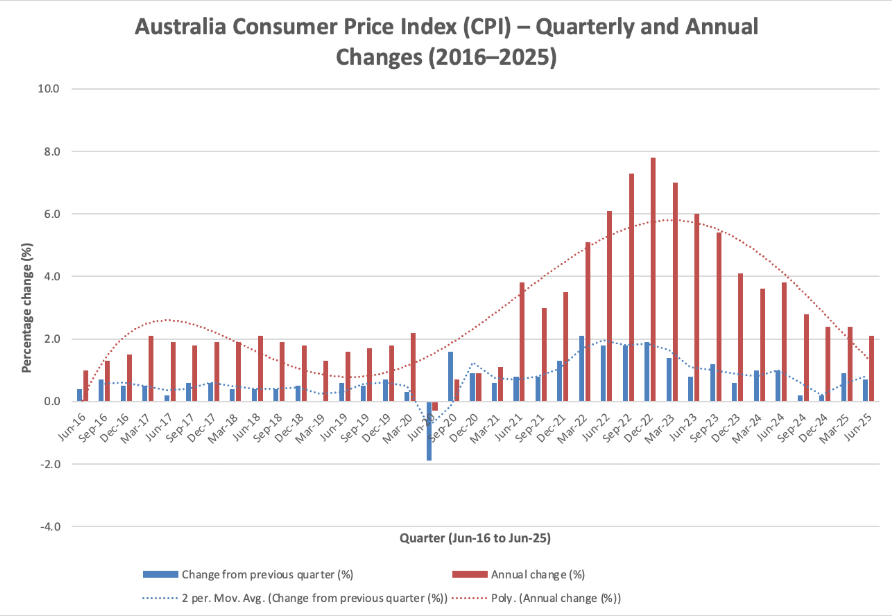
This chart shows how Australia’s Consumer Price Index (CPI) has moved between 2016 and 2025, with the blue bars tracking quarterly changes and the red bars showing annual inflation. By adding a two-period moving average and a polynomial trendline, the data tells a clearer story: inflation was fairly steady before 2020, dropped briefly during COVID, then spiked sharply through 2021–2023 before easing back down towards normal levels by 2025. Presenting the data this way makes it easier to see both short-term fluctuations and the bigger cycle, which is useful for our visual data centre simulation because it turns complex economic numbers into something more intuitive and engaging.
Policy
Data and Digital Strategy - Implementation Plan
The implementation plan of the data and digital government strategy 2024 of the Australian government outlines the strategic vision for data and digital services; however, it is worth mentioning that it omits discussion on the Data Centre infrastructure. We consider it a strategic opportunity, not a flaw, to leverage Australia’s competitive advantage to lead AI and cloud computing hub of the region.
Australia needs an explicit National strategy to maximise the realisation of the vision to become “Data centre capital of the Asia Pacific”, as said by the CEO of Atlassian and numerous salient leaders of Australia. This involves public–private partnerships and investments in sovereign data centres, eyeing sustainable energy sources and Strategic land allocation.
Our proposed proactive approach shall attract significant foreign investment, foster innovation and ensure data sovereignty in the AI age. On the contrary, a delayed or unclear plan may risk this significant economic opportunity to competitors.
Legislation
We looked at policies that would be relevant to data centre construction, that would be useful to reference as part of an integrated chatbot in our solution:
-The Building Code of Australia
-National Australian Built Environment Rating System (NABERS)
-Greenhouse and Energy Minimum Standards Act 2012
-South Australia - Planning, Development and Infrastructure Act 2016
-Security of Critical Infrastructure and Other Legislation Amendment (Enhanced Response and Prevention) Act 2024
