
Amp up SA: Forecasting Electric Transport for Grid Resilience
How might we prepare our state for the growing electrification of the transport sector?
Go to Challenge | 3 teams have entered this challenge.
Team Name:
GridGuardians SA
Team Members:

GridGuardians SA
South Australia's Renewable Energy Pioneers
South Australia has emerged as a trailblazer in the renewable energy sector, achieving a remarkable feat in increasing its renewable energy share from less than 1% to over 70% in just 16 years. The state has set ambitious goals, aiming to achieve 100% renewable energy by 2030. This remarkable transformation signifies a significant shift towards a more sustainable energy future.
Grid Planning in a Renewable Era
However, with this abundance of renewable energy, critical questions arise. How do we strategically plan and adapt our electrical grid to meet the evolving needs and expectations of the public? For instance, have you ever hesitated to embark on a long journey in your electric vehicle, uncertain about finding a reliable charging station along the way?
According to data from the Australian Energy Market Operator (AEMO) and Australian Bureau of Statistics(ABS), it is estimated that electricity consumption in South Australia will surge significantly, potentially increasing by a staggering 100-fold by the year 2030. This exponential rise in demand can be attributed primarily to the proliferation of electric vehicles (EVs), the widespread adoption of solar panels, and the rapid expansion of fast-charging infrastructure.
Our challenge centers on predicting the growth trajectory of electric vehicles within South Australia and understanding their profound impact on energy demand. Additionally, we aim to assess the implications of this energy demand surge on South Australia's ambitious net-zero emissions target for the year 2050.
In the context of this challenge, we will delve into several key aspects:
Electric Vehicle Growth Prediction: We will employ data analytics and modeling techniques to forecast the growth of electric vehicles across various segments, including personal cars, public transit, and commercial fleets by different locations and age of vehicles. This prediction will be essential for grid planning and infrastructure development.
Energy Demand Analysis: Our project will scrutinize the increased energy demand resulting from the surge in electric vehicles, solar installations, and fast-charging points. This analysis will provide critical insights into how South Australia's grid must evolve to accommodate this demand effectively.
Alignment with Net-Zero 2050 Target: We will evaluate how the electrification of transportation might either accelerate or hinder South Australia's commitment to achieving a net-zero emissions target by 2050. This assessment is vital for ensuring a harmonious transition towards a sustainable energy future.
Comprehensive Data Integration for In-Depth Analysis
We have undertaken an extensive effort to seamlessly integrate diverse official data sources. This comprehensive approach enables us to conduct an in-depth, multi-dimensional analysis. By harnessing the power of these authoritative datasets, we gain insights that illuminate the complex nuances of South Australia's evolving energy landscape.
Leveraging Advanced Machine Learning for Precision Forecasting
In pursuit of heightened accuracy, we advocate for the strategic deployment of advanced machine learning algorithms. These cutting-edge techniques are capable of unraveling intricate patterns within the data. Furthermore, they possess the capacity to adapt and improve over time, elevating the precision of our forecasts. This advancement is essential for accurately projecting the growth trajectory of electric vehicles and the resulting surge in energy demand.
Real-Time Dashboard: Fusing Practicality and User-Friendliness
At the heart of our project lies the creation of a real-time dashboard that harmonizes practical functionality with user-friendly design. This dynamic dashboard serves as an intuitive interface catering to the diverse needs of both the general public and policy-makers. Through interactive data visualizations and customizable features, it empowers users to navigate and comprehend the projected impact of electric vehicle adoption on energy demand.
Direct Alignment with South Australia's Net-Zero 2050 Vision
Our unwavering commitment to South Australia's net-zero emissions target by 2050 finds a direct expression in our comprehensive report. Grounded in a profound sense of social and environmental responsibility, this report not only elucidates the consequences of electrification for the energy ecosystem but also underscores the intrinsic connection between sustainable practices and a flourishing future.
In "Green Path for Grid Resilience," our approach is underpinned by robust data integration, pioneering machine learning methodologies, an intuitive real-time dashboard, and an unequivocal dedication to sustainability. These elements collectively steer us toward a future defined by sustainability, resilience, and a harmonious coexistence with our environment. We eagerly anticipate sharing our insights, findings, and recommendations with all stakeholders, as we collectively pave the way toward a greener and more resilient South Australia.
Our commitment to robust analysis starts with the foundation of real, local, and high-quality datasets. To ensure accuracy and reliability, our data primarily stem from multiple esteemed sources:
We've conducted a meticulous analysis of vehicle data, highlighting the top 10 suburbs in Adelaide with the highest number of registered vehicles in 2023. Additionally, we've gauged the age distribution of these vehicles, particularly focusing on the number of 10-year-old cars. This data provides a valuable reference point for projecting future vehicle numbers.
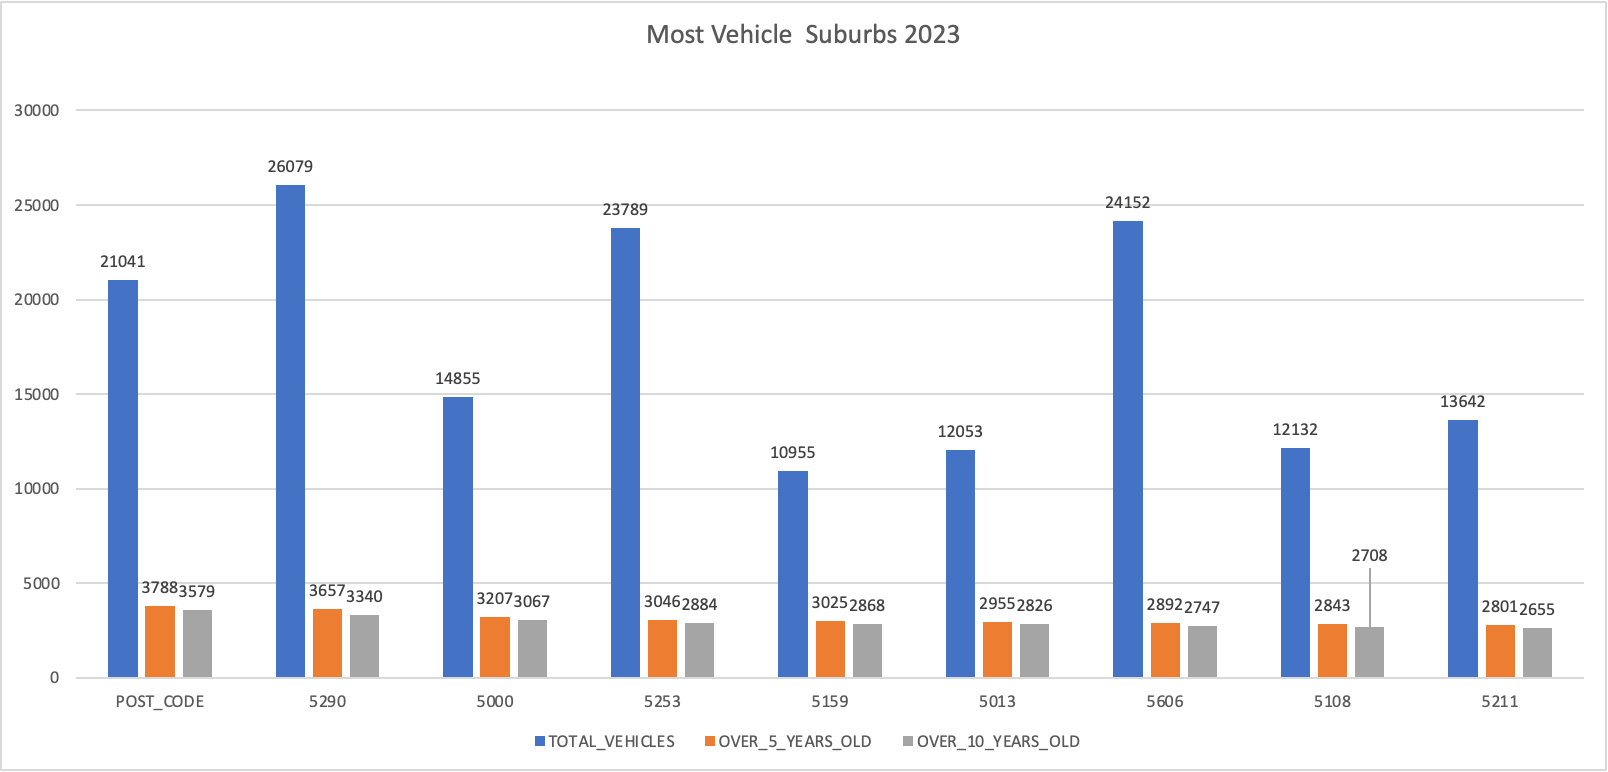
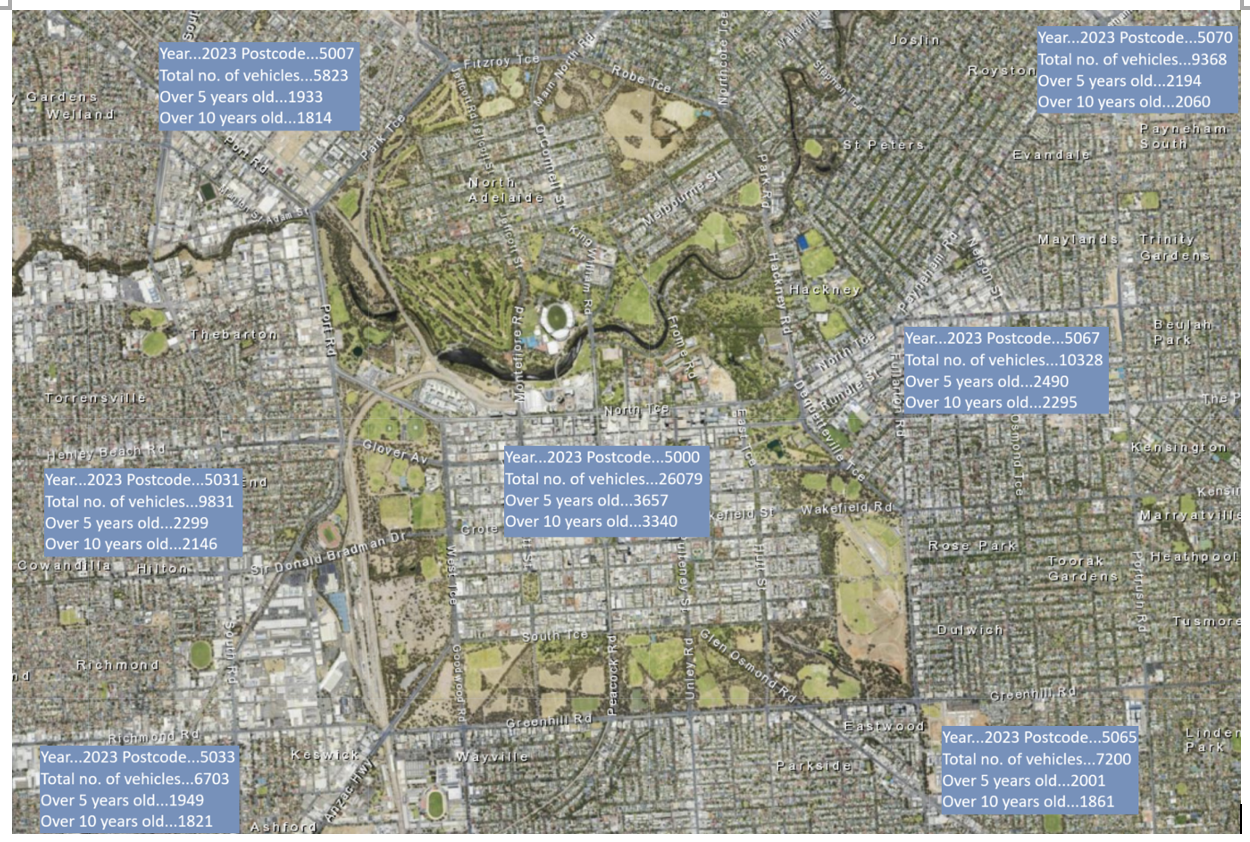
Furthermore, we've translated this data onto a map, creating a visual representation of the geographic distribution of vehicles. This spatial perspective enhances our understanding of vehicle density across the city.
Considering the ongoing policies for passenger vehicle electrification, our analysis extends to other transport segments. We've identified light commercial vehicles as a potential candidate for electrification, representing a forward-looking insight.

Recognizing that grid resilience hinges on multiple factors, we've undertaken a rigorous correlation analysis. We've curated 69 variables spanning 2015 to 2022, shedding light on the intricate relationships between economic activity, population dynamics, transportation fleets, and more.
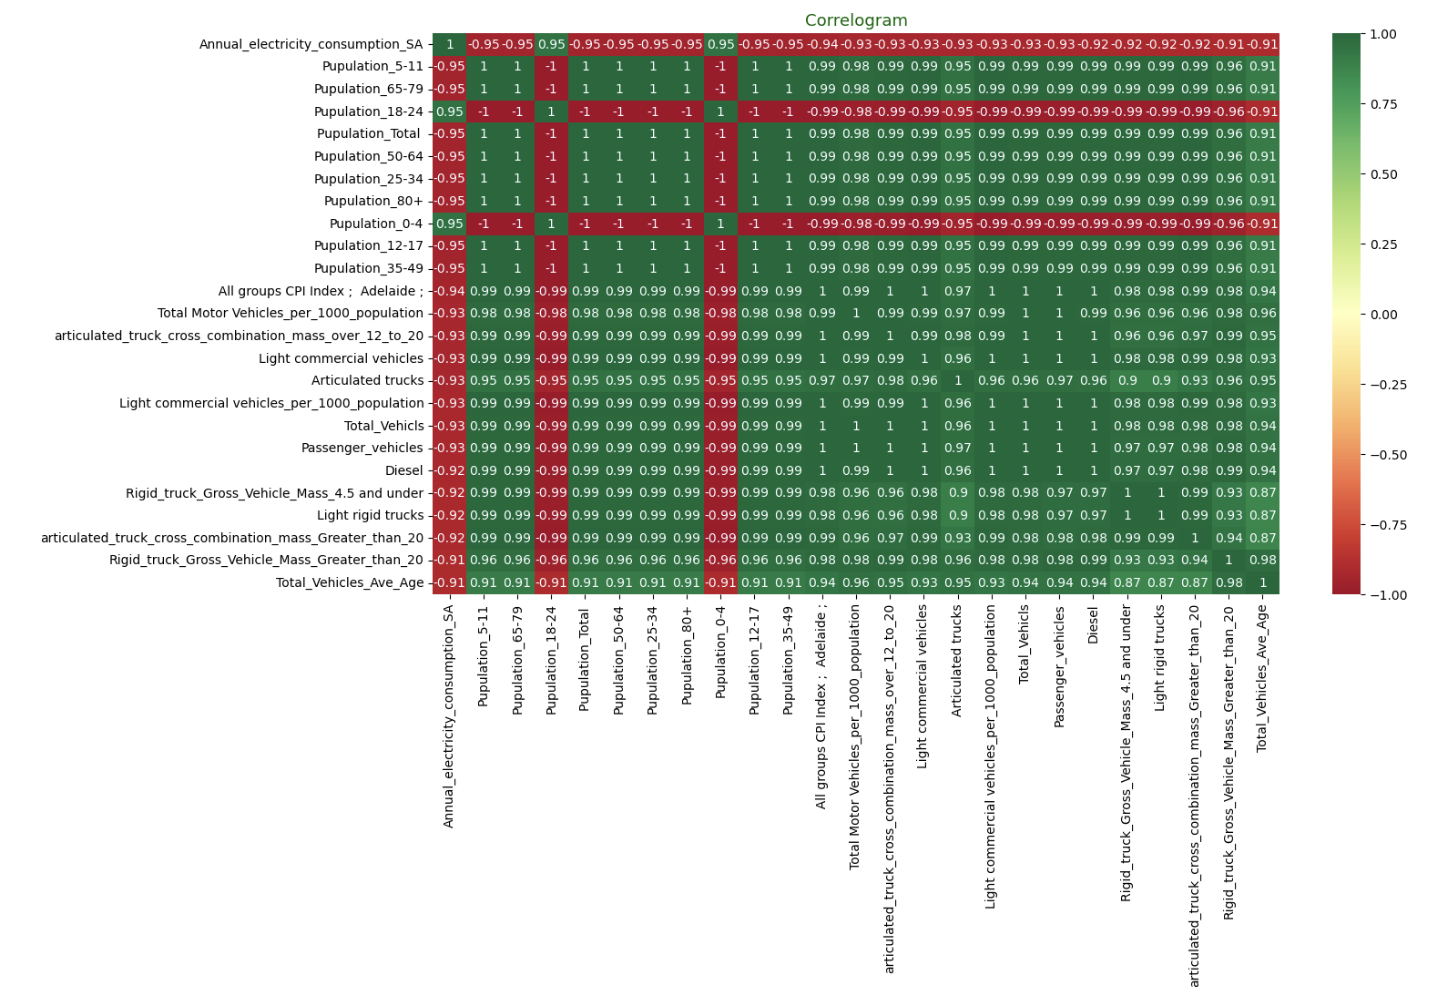
The above graph unveils significant insights:
* Electricity consumption strongly correlates with population, particularly age groups 0-4 and 18-25.
* The number of trucks exhibits a negative correlation with electricity consumption.
* Diesel fuel type demonstrates a pronounced negative correlation with electricity consumption.
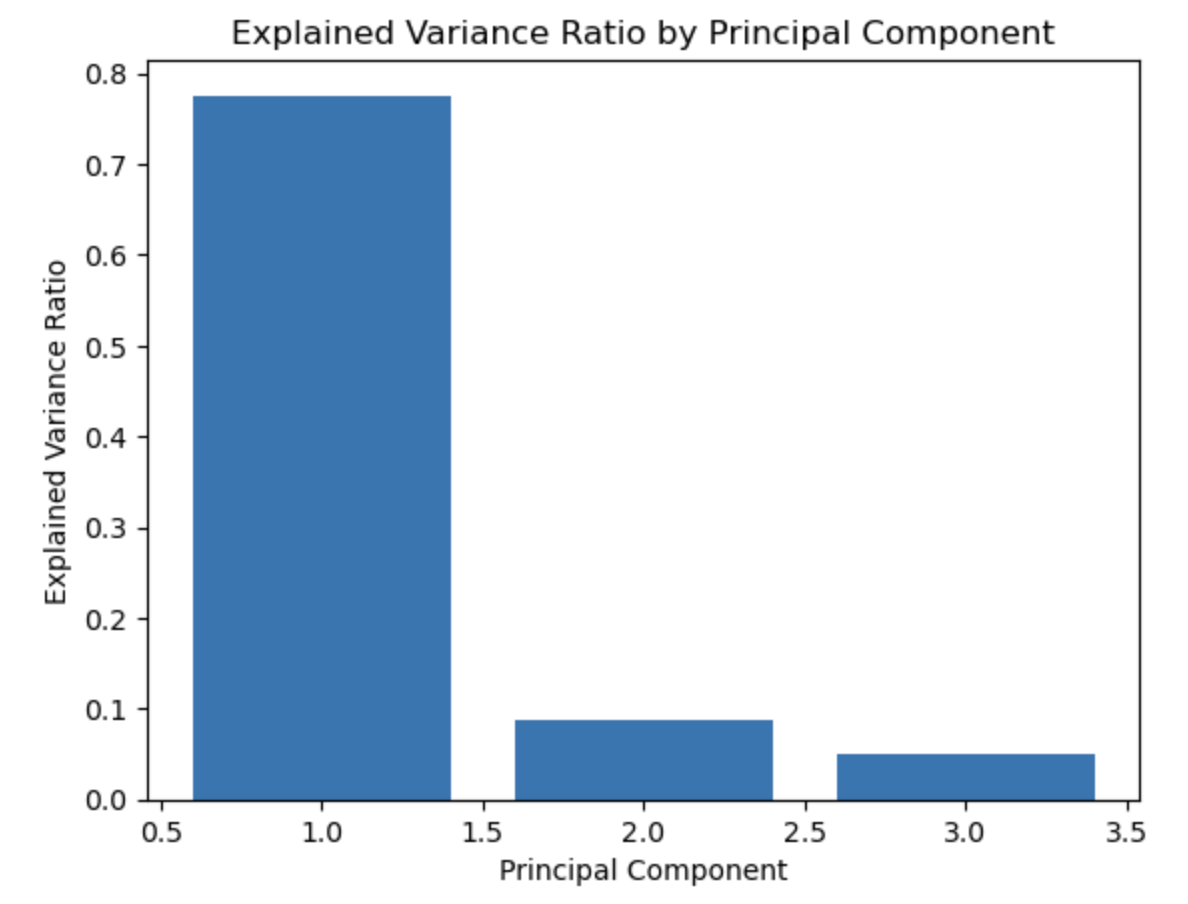
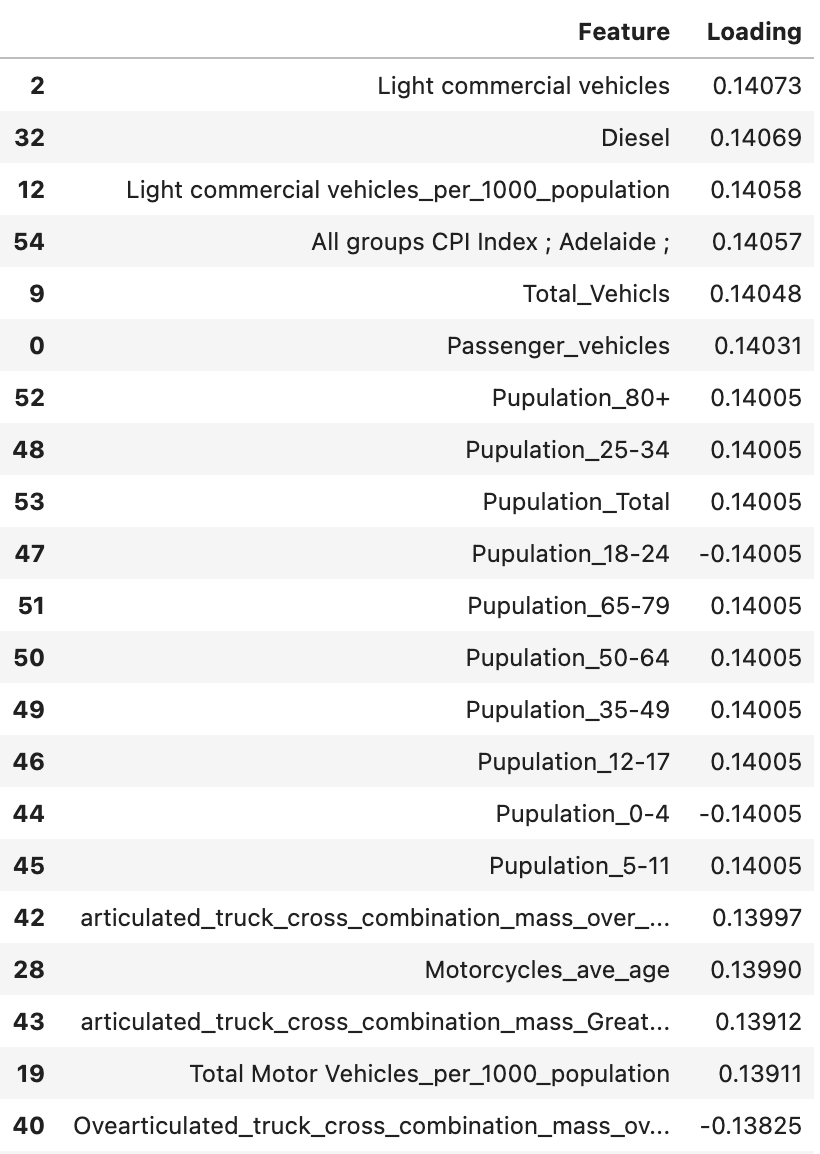
In tandem, our Principal Component Analysis (PCA) uncovers crucial data features. This analysis reveals the pivotal role of light vehicles and diesel in influencing electricity consumption.
While time constraints limited our implementation, we envision employing sophisticated machine learning models to delve deeper into variable relationships and projections.
* Long Short-Term Memory (LSTM) Networks: Ideal for capturing intricate temporal dependencies, particularly in cases with long-term and nonlinear patterns.
* XGBoost or LightGBM: Well-suited for time series forecasting by incorporating lagged features. These models excel in handling relevant feature engineering.
These models hold the potential to assess the impact of vehicles on energy demand.
We've created an informative dashboard to facilitate data dissemination. For comprehensive details, visit our Project Webpage. This platform aims to foster knowledge exchange and drive insights for a greener, more resilient energy landscape.
Description of Use To Analysis Vehicles growth.
Description of Use Collect details of flight trips from Adelaide to other cities including number of passengers and trip distance. The total number of flights if it were to be electrified can aid in estimating electricity demand.
Description of Use Get the total number of vehicles by type.
Go to Challenge | 3 teams have entered this challenge.