Australia's Shift to H2 Freight

Project Info

Hydra thumbnail

Team Name


Hydra


Team Members


Reuben , Brad , Nick , Harrison

Project Description


"Australia's Shift to H2 Freight" presents an interactive visualisation of Australia's freight networks, through the lens of a transition to hydrogen fuels. It uses NFDH data sets, including Freight Vehicle Congestion and National Key Freight Routes Map, combined with some listed assumptions and metrics. The visualisation includes map display of geospatial data, graphs, metrics, and inputs to allow adjustment of assumptions.


Data Story


Climate change has been declared as "a threat to human well-being and planetary health", and much of this impact is due to the emissions from burning fossil fuels. Freight transportation alone is responsible for 8% of global greenhouse gas emissions.

Hydrogen is an alternative fuel source that can be generated using renewable energy. Australia is planning significant investment as a means to reduce emissions, the Australian government's State of Hydrogen 2022 report states that Australian hydrogen projects have "$230-300 billion of potential investment. This represents close to 40% of all global clean hydrogen project announcements".

Freight transportation is predicted to adopt hydrogen fuel over other sources. Mckinsey predicts the hydrogen refuelling market is set to increase 105% per annum by 2035, where "95 percent of [hydrogen] demand by volume will come from commercial vehicles".

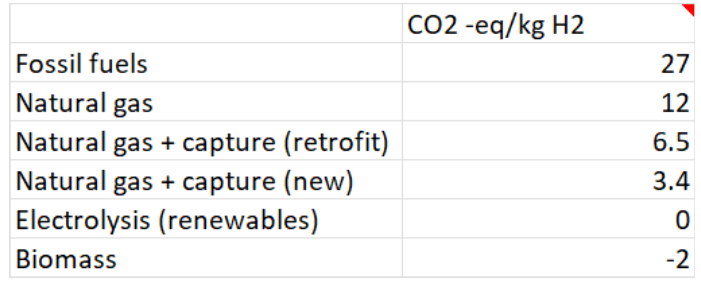
Hydrogen adoption does not guarantee emissions reduction, only 2% of global hydrogen production is using renewable sources. A 2023 report from the International Energy Agency outlines the CO2 generated from different sources, summarised below:

CO2 emissions by fuel source

Our demand for commodities is growing. The NSW Government predicts Sydney commodity demand will increase by 96% by 2056, due to population increase, trends in household income, and industrial production. This will result in increased freight fleets, and therefore increased emissions from those fleets.

In our project, we have created a web application that allows decision-makers to explore:

  • Are emission reductions from hydrogen adoption outpacing our increased demand for commodities?
  • How can we compare different freight transportation types on their emissions?
  • Where should we focus our emissions reduction effort?

Users can adjust hydrogen adoption, hydrogen generation, fleet demand, and commodity demand. They can then see how this impacts overall fleet metrics, including carbon emissions. The year can be selected to populate inputs with forecasted data according to publicly available data sources, and use this as a baseline to see whether we are on track in our emissions reductions target.

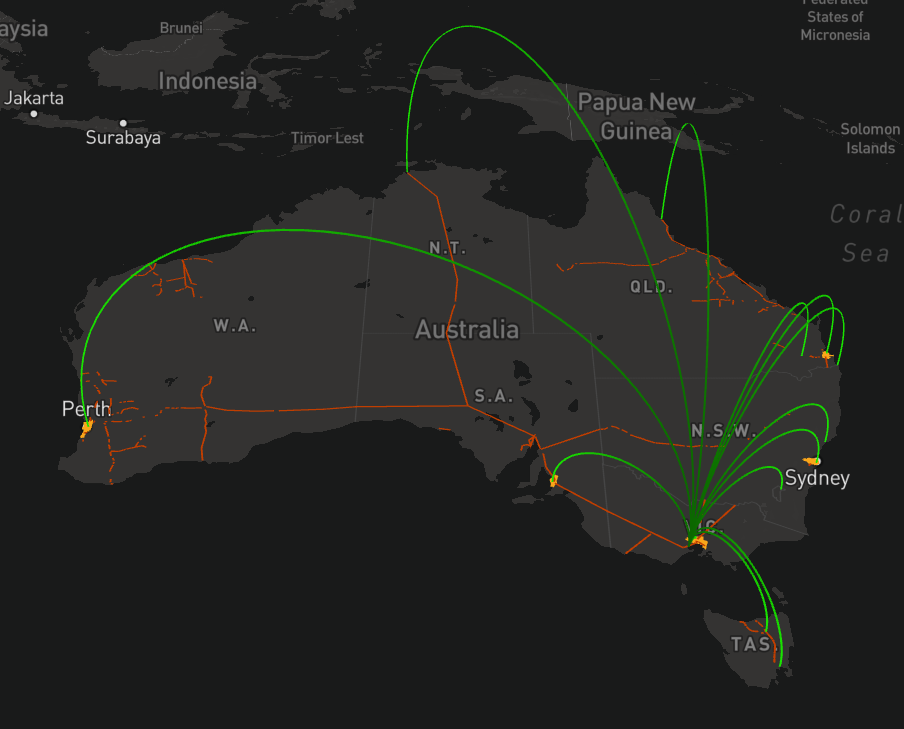
The application also allows users to investigate individual freight routes. They are visualised using freight vehicle congestion data and national key freight routes map, and can be inspected using natural language powered by generative artificial intelligence.

Future additions to this project would allow users to explore how different routes would impact fleet metrics, and expand the number of metrics to include other factors, such as cost.


Evidence of Work

Video

Homepage

Project Image

Team DataSets

Current production of hydrogen from different sources

Description of Use Used for baseline hydrogen production

Data Set

CO2 emissions from freight transport

Description of Use Used for baseline emissions

Data Set

CO2 produced from hydrogen generation techniques

Description of Use Used to predict CO2 emissions from hydrogen generation sources

Data Set

Forecasted commodity demand

Description of Use Used to generate forecast slider values

Data Set

National Key Freight Routes Map

Description of Use Used to show national rail and road freight routes on maps.

Data Set

Freight Vehicle Congestion in Australia's 5 Major Cities

Description of Use Used to show local roads data on maps.

Data Set

Challenge Entries

Identify plausible domestic freight routes across different modes of transport

Determine the most efficient way of moving freight around Australia using average speed of trucks and trains. An intermodal train can load 100 to 150 shipping containers. Goods can only move between trucks and trains at seaports and intermodal terminals. Consider using Google Maps Places API to identify major manufacturers and distribution centres.

Go to Challenge | 7 teams have entered this challenge.

Generative AI: Unleashing the Power of Open Data

Explore the potential of Generative AI in conjunction with Open Data to empower communities and foster positive social impact. This challenge invites participants to leverage Generative AI models to analyse and derive insights from Open Data sourced from government datasets. By combining the power of Generative AI with the wealth of Open Data available, participants can create innovative solutions that address real-world challenges and benefit communities.

Go to Challenge | 29 teams have entered this challenge.

Measuring freight performance across modes through universal metrics

Australia’s domestic freight demand has increased significantly over the last four decades, and continues to grow. With this growth, knowing what, where and how freight is moving is essential. Help the freight sector across government and industry to come up with ways to design metrics that are interoperable across all modes to measure performance.

Go to Challenge | 6 teams have entered this challenge.

Measuring and reducing carbon emissions from physical infrastructure assets

Build a platform / solution to raise awareness of the importance of decarbonisation and to provide resources to help people and businesses make changes to their lifestyles and practices. By enabling a data-driven, collaborative, and user-friendly platforms for decarbonisation, Australia can accelerate its journey to net zero emissions.

Go to Challenge | 11 teams have entered this challenge.