Every Way We Save

Project Info

EWWE thumbnail

Team Name


EWWE


Team Members


Anna and 3 other members with unpublished profiles.

Project Description


1. Our Idea

In the last 48 hours, our team has built a smart analytic data-driven platform to allow users to connect to personal accounts such as myki, Everyday Rewards or Flybus, online food delivery services, etc. such that the platform can collect users' behavior, consumption pattern and living habits on Transport, Electricity, Waste disposal, etc. and provide personal AI-generated recommendations to adjust their ways of living to reduce carbon emissions (save our planet!) and save money.

Regular and active users meeting reduction targets will be rewarded vouchers from supporting merchants as incentives to continue using the platform.

Pic Of Platform

2. User Flow

As an example, we have created a video and description below for a user from Victoria in a household of 4, to illustrate the feature.

i. Login

Users can set up personal profile for login and track their consumption behaviours and living habits.

Pic Of Login

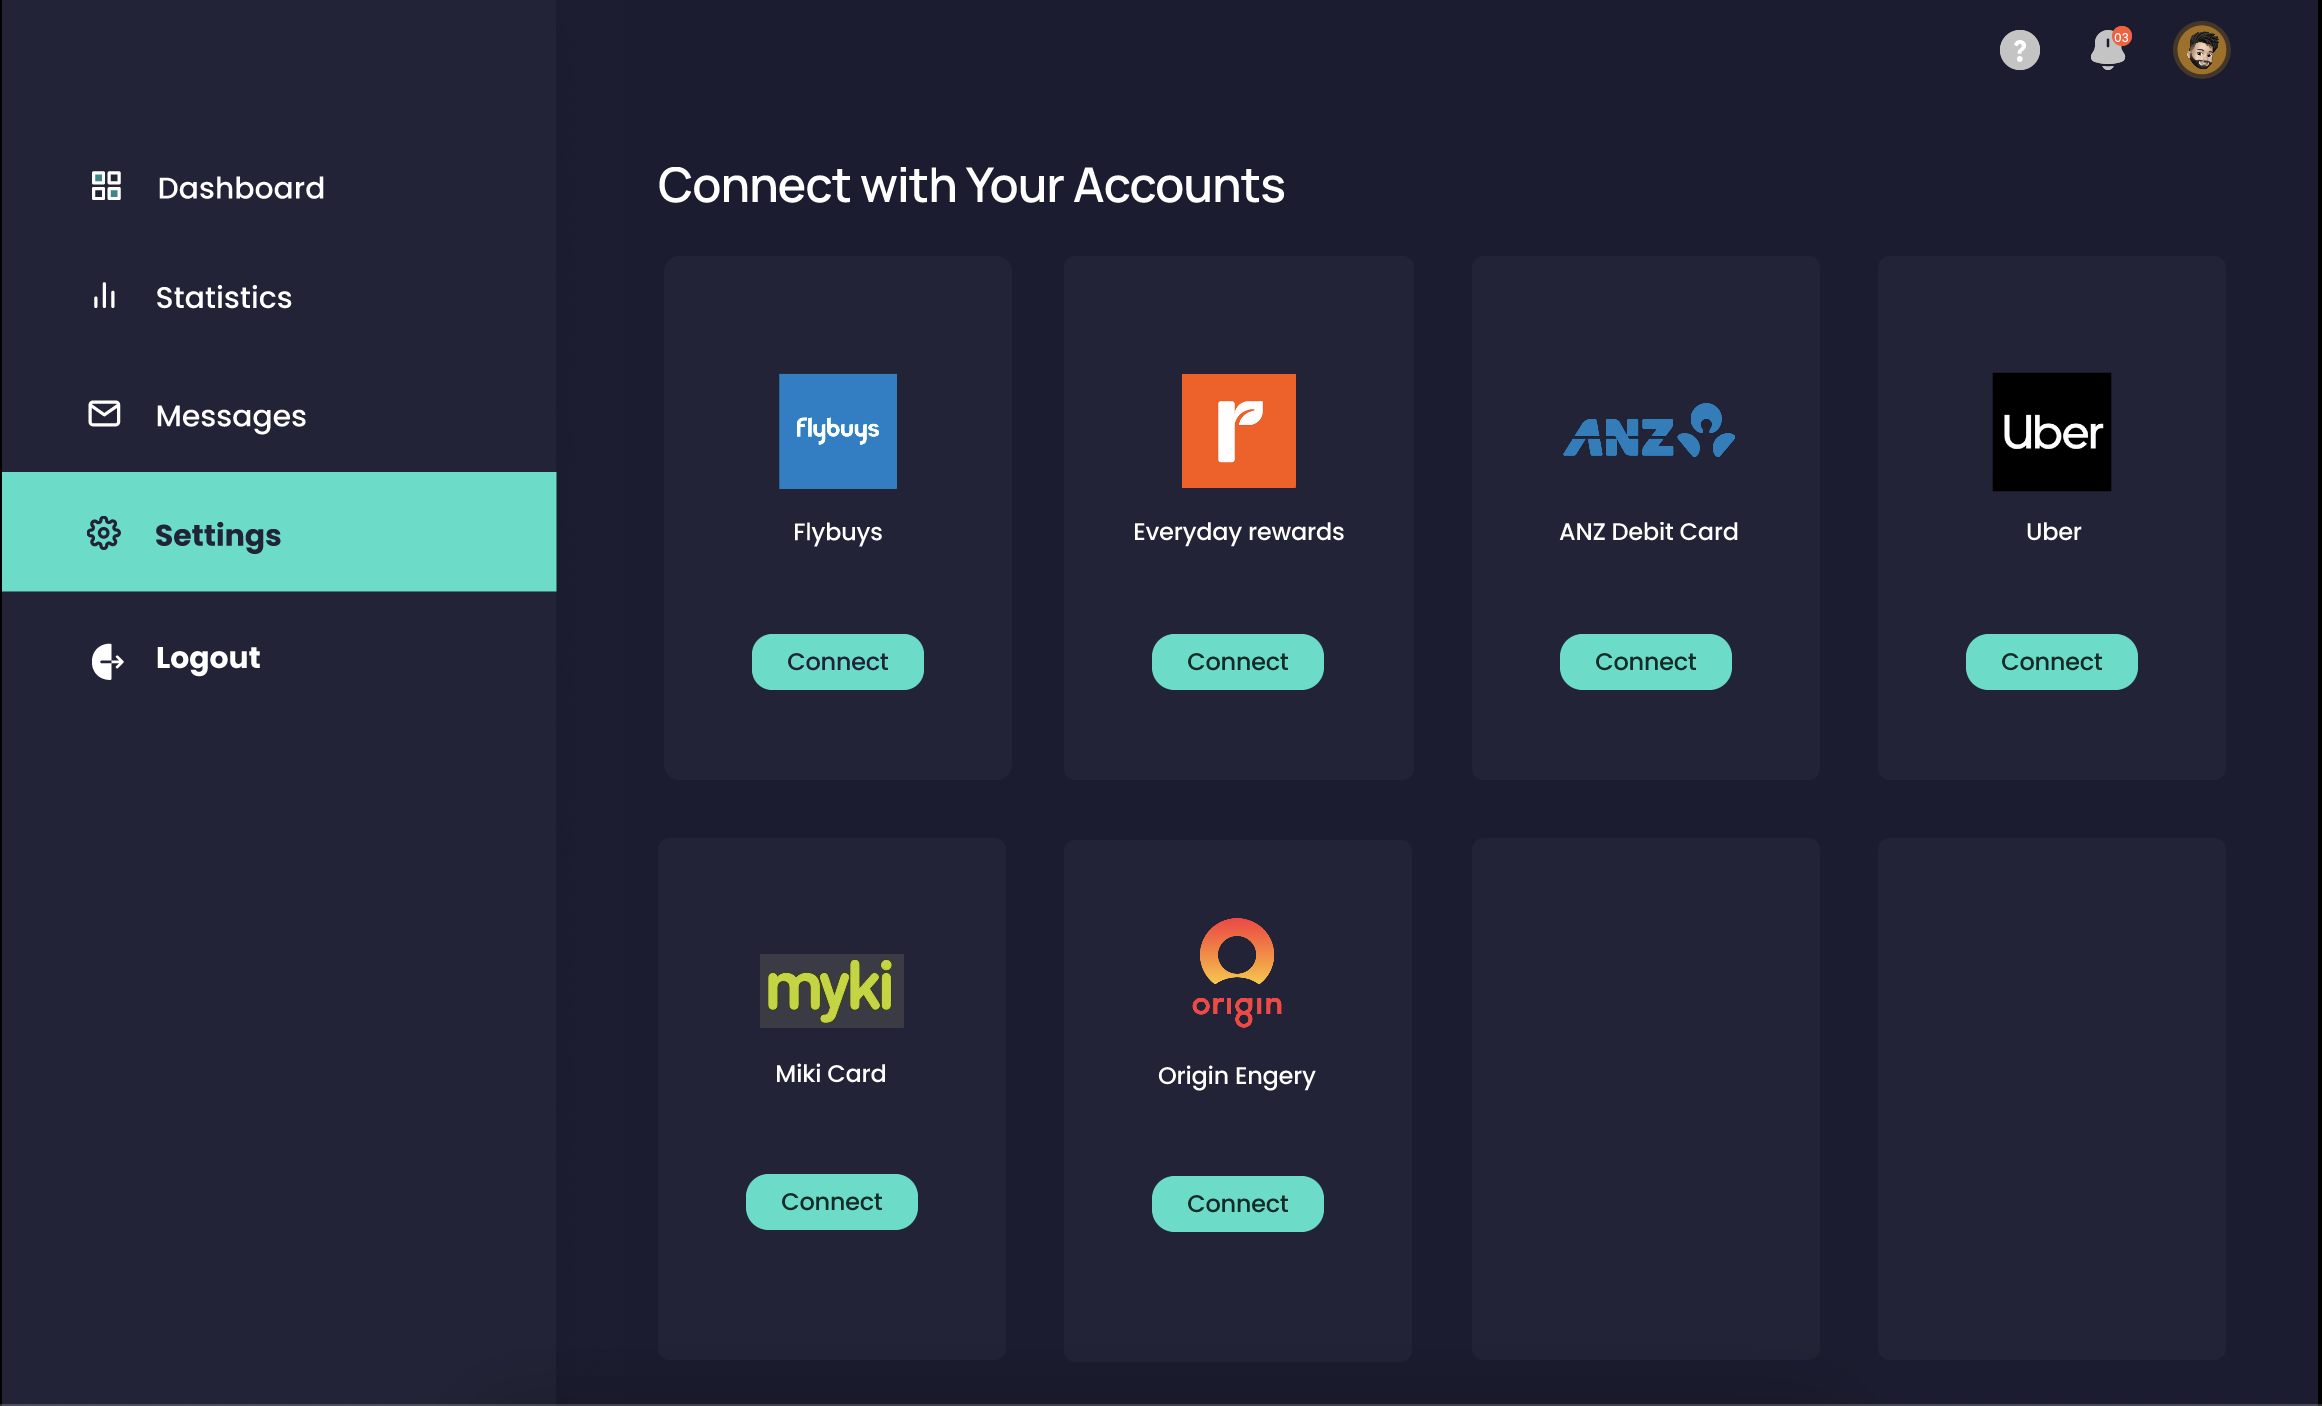
ii. Connect with Personal Accounts

Users can connect to their personal accounts of debit card, rewards card, energy account etc, so that the platform can regularly pull user behavior across transport, usage of water, electricity, waste management, etc.

Pic Of Connected Page

iii. Smart Analysis and AI suggested
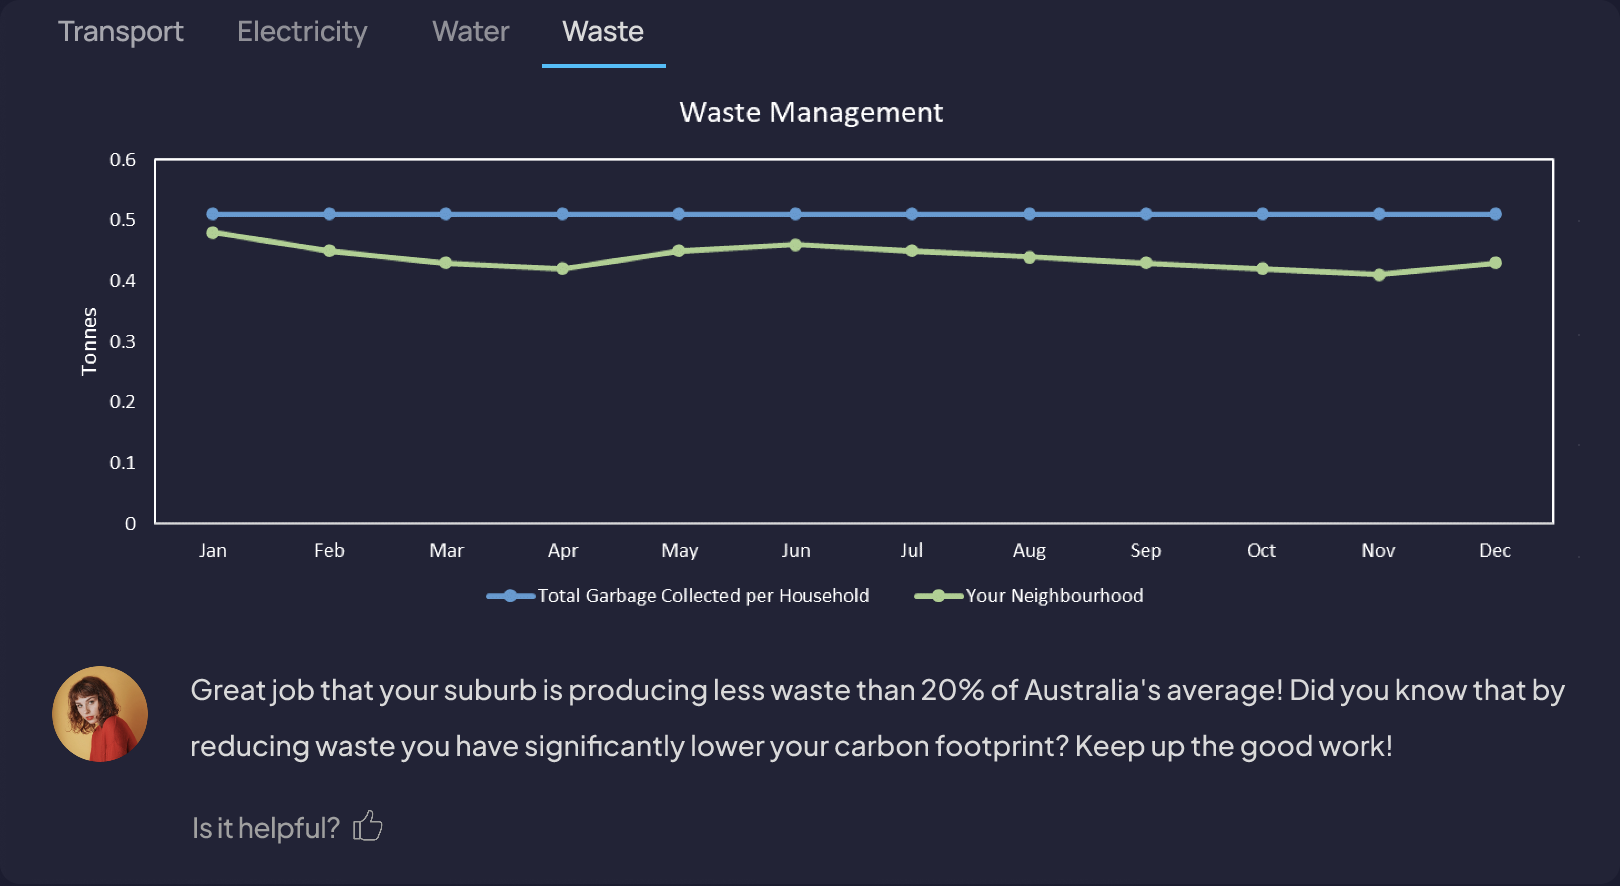
a) Waste Management

The platform would compare user consumption behavior with the consumption behavior of average Australia, and offer insights. For example in the Waste Usage Analysis feature below, the platform is comparing Australia's Average Garbage Collected per Household vs the statistics of the user's neighborhood. It then offered insight that the user is performing well and encouraged user to keep the good work.
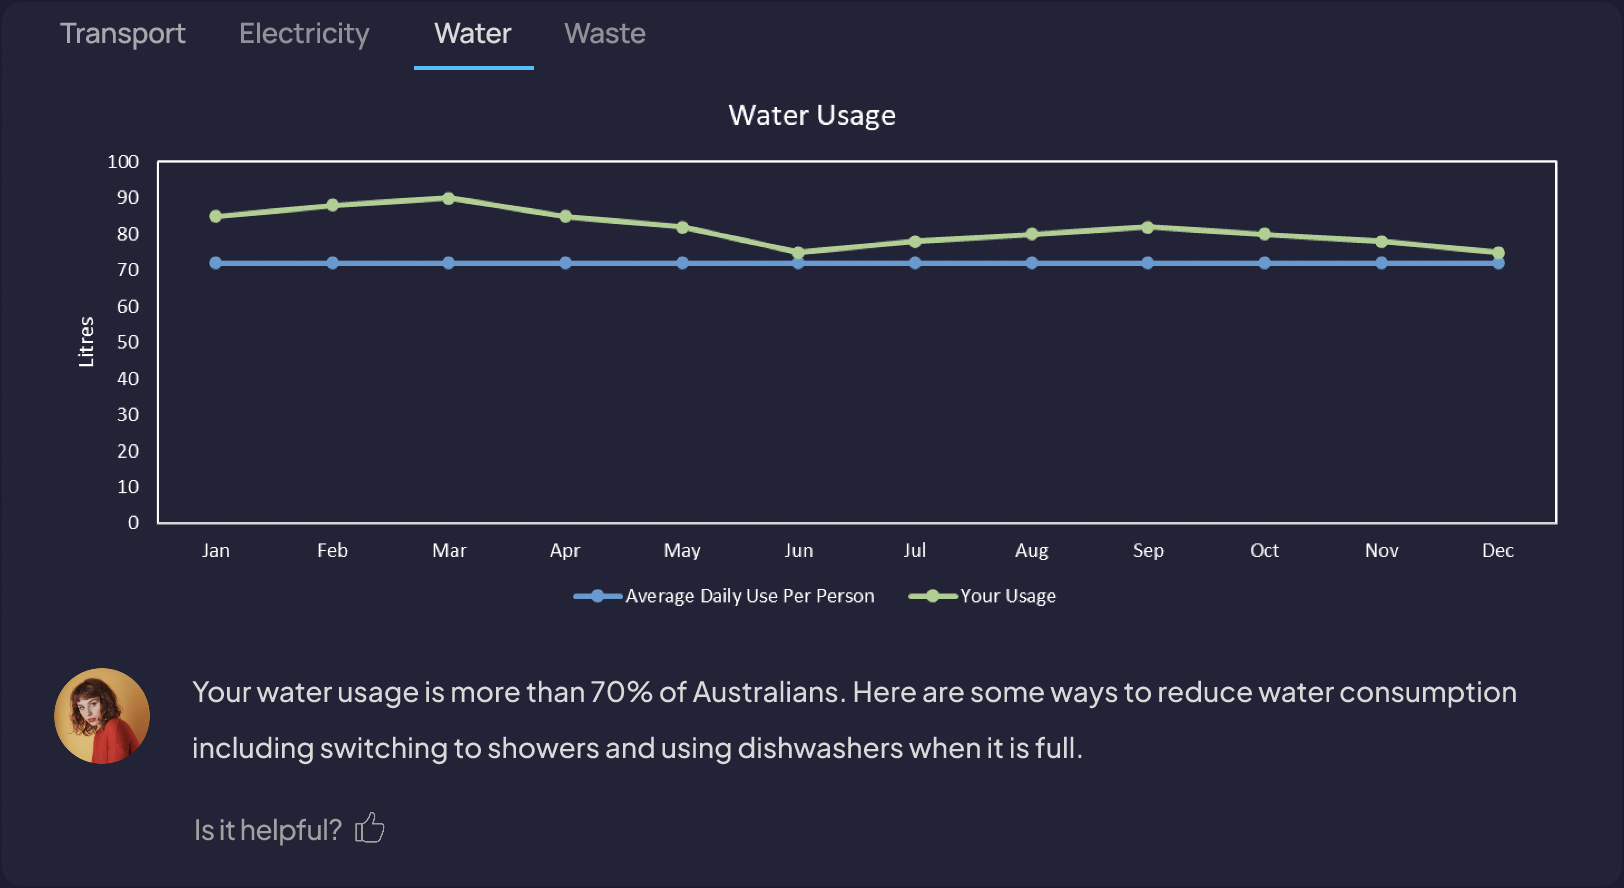
Pic Of Waste Management

b) Water

Similarly, attached below is the dashboard for water consumption analysis with insight for user.

Pic Of Water

c) Electricity

Similarly, attached below is the dashboard for electricity consumption analysis with insight for user.
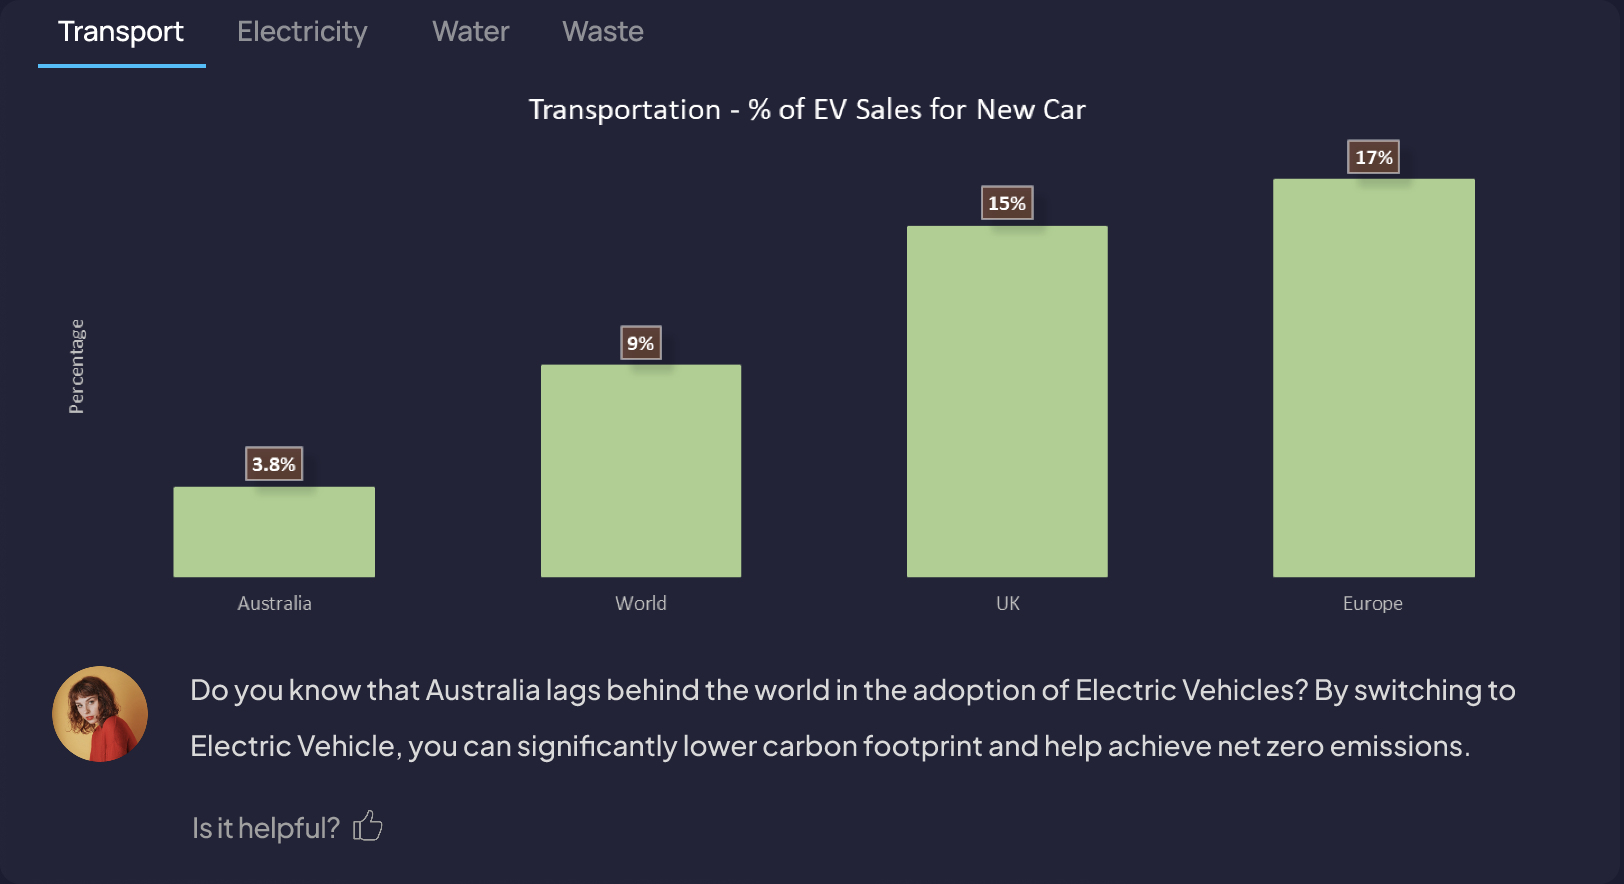
Pic Of Electricity

d) Transport

Similarly, attached below is the dashboard for transportation analysis with insight for user.

Pic Of Transport

3. Data Story

Details of Data Use is available in the separate section "Data Story".
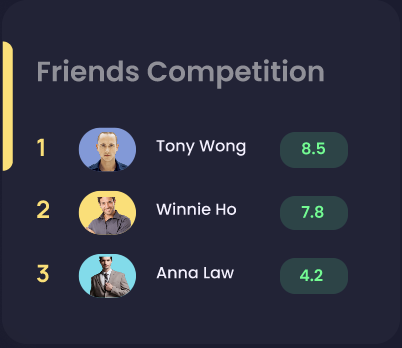
4. Social Element

Users will be able to view the latest scores of their friends, as a social element which allows them to connect with others also to know where do they stand among their peers. The leader board will motivate users to adjust their living habits and consumption behaviours in order to stay on top of the ranking and to get rewards!

Pic Of Score & Ranking

5. Rewards

Regular and active users meeting reduction targets will be rewarded vouchers from supporting merchants, as incentive to continue using the platform. Also rewards will be given when users make referrals to family friends. The more referrals they make, the more rewards they get!

6. Closing Remarks

Last but not least, this hackathon was a very interesting and rewarding experience to the team. The EWWE team would like to thank the organisers, sponsors and all helpers along this wonderful 48-hour journey.
Pic Of Team


Data Story


When deriving the consumption statistics of average Australian, we have made use of a number of official resources from the Australian Government, Businesses and data sources required by the project specification page in GovHack.

The data sets were very helpful for understanding the consumption behavior of average Australian on water, electricity, transport and waste management.

The full list of data use is listed as follows.

Household : Australian Bureau of Statistics - Census of Population and Housing 2006, 2011, 2016 and 2021
Transport : Climate Council - Driving Down Car Pollution in Cities
Electricity : Australian Energy Regulator - Residential energy consumption benchmarks Final report
Water : Essential Services Commission - Average household water bills in Victoria by
Waste : Recycling Victoria - Victorian local government waste data


Evidence of Work

Video

Project Image

Team DataSets

Essential Services Commission - Average household water bills in Victoria

Description of Use Used the dataset to find the average household water consumption in Australia.

Data Set

Recycling Victoria - Victorian local government waste data

Description of Use Used the dataset to find the average household waste consumption in Australia.

Data Set

Australian Energy Regulator - Residential energy consumption benchmarks Final report

Description of Use Used the data set to find the average electricity usage of Australia Household.

Data Set

Climate Council - Transport Emissions: Driving Down Car Pollution in Cities

Description of Use Used the data set to find out the adoption of electrical vehicles in Australia.

Data Set

Australian Bureau of Statistics - Census of Population and Housing 2006, 2011, 2016 and 2021

Description of Use Used the dataset for finding the household number of Australia across the year.

Data Set

Challenge Entries

Generative AI: Unleashing the Power of Open Data

Explore the potential of Generative AI in conjunction with Open Data to empower communities and foster positive social impact. This challenge invites participants to leverage Generative AI models to analyse and derive insights from Open Data sourced from government datasets. By combining the power of Generative AI with the wealth of Open Data available, participants can create innovative solutions that address real-world challenges and benefit communities.

Go to Challenge | 29 teams have entered this challenge.

Measuring Emissions – Where should we start? Standardising data for tracking, monitoring, and reporting emissions

Climate change is forcing governments and regulators to enforce stringent norms for businesses to reduce emissions and address environmental risks. There is no standard framework for reporting ESG and climate related risks, leading to non-uniform data. How can this issue be addressed to help organisations better report on their emissions?

Go to Challenge | 13 teams have entered this challenge.

Best Creative Use of Data in Response to ESG

How can you showcase data in a creative manner to respond to ESG challenges? How can we present and visualise data to stimulate conversation and promote change?

Go to Challenge | 33 teams have entered this challenge.

Measuring and reducing carbon emissions from physical infrastructure assets

Build a platform / solution to raise awareness of the importance of decarbonisation and to provide resources to help people and businesses make changes to their lifestyles and practices. By enabling a data-driven, collaborative, and user-friendly platforms for decarbonisation, Australia can accelerate its journey to net zero emissions.

Go to Challenge | 11 teams have entered this challenge.